


Clear and Actionable: Wavicle’s Winning Dashboard
- Amazon Quicksight
- BI Reporting & Visualizations
 09 May 2023
- 2 min read


A great dashboard tells a clear story with actionable insights. Building that story was the goal for Wavicle’s team when they recently entered the Amazon Quick Suite Partners Viz Challenge, a data visualization design competition on visual analytics and storytelling skills using Amazon Quick Suite.
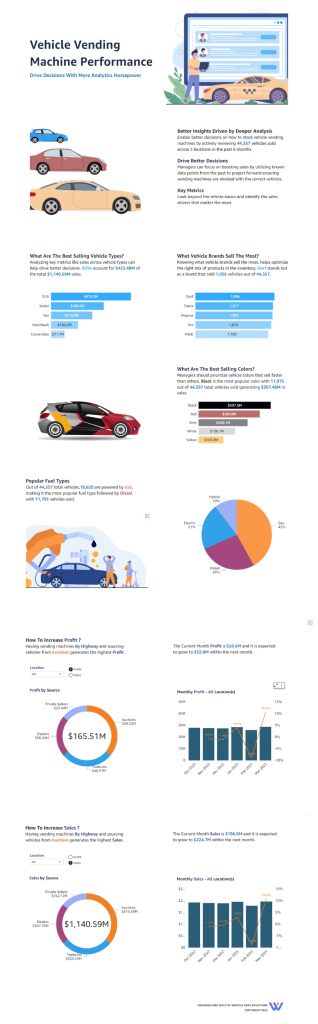
Their submission, which was ranked first of all dashboards from US-based teams and took third place overall, focuses on delivering analytics and insights for retailers utilizing vehicle vending machines (VVMs). Developed with Amazon Quick Suite, the vehicle vending machine performance dashboard provides immediate and actionable intelligence leveraging six months of previous VVM sales data to identify current optimization opportunities and project future outcomes.
The dashboard infographic delivers key analytics to help retailers stock their VVMs to promote sales and profits. Leveraging data about the best-selling vehicle types, brands, colors, and fuel types, the dashboard offers clear direction for retailers to optimize their inventory. It also answers critical questions to help retailers maximize sales and profits for their VVMs and gain a competitive edge in the market.
What does an award-winning dashboard look like? Keep scrolling to check out the infographic dashboard for yourself.
This dashboard reflects work from team leader Akhila Baddam, as well as Hari Rajan, Serge Andoh, Melissa Casole, Akshara Achrekar, Siddharth Arora, Joe Azer, and Rachitha Dhanraj.
Wish your dashboards delivered the full story? We can help. Contact our team today.
WIT Leader
Data Team
Builds secure, governed data platforms that power analytics and feed AI models with clean, real-time, and high-quality data.
View all my PostsRelated Posts


- Blog
- Automated BI Migration
- Conversational Analytics
Automated BI Migration: Moving Tableau and Powe...
-
24 Apr 2026
-
10 min read

- Blog
- Automated ETL Migration
- AWS Glue
ETL Migration Cost Optimization: Legacy ETL to ...
-
24 Apr 2026
-
10 min read


- Blog
- Azure
- Databricks
Enabling Near Real-Time Operational Decision-Ma...
-
24 Feb 2026
-
5 min read


- Blog
- Advanced Analytics
- Healthcare
Computer Vision for Health: Living Longer
-
07 Jul 2025
-
16 min read


- Blog
- Amazon Quicksight
- BI Reporting & Visualizations
5 Major Benefits of Amazon Quick Suite That you...
-
28 May 2025
-
3 min read


- Blog
- Amazon Quicksight
- BI Reporting & Visualizations
Tips and Tricks to Get the Most Out of Amazon Q...
-
07 May 2025
-
4 min read

- Blog
- Data Governance
- Healthcare
Rethinking Healthcare Data Governance: From Sil...
-
05 May 2025
-
3 min read

- Blog
- Data Management
- Healthcare
Building the Future of Healthcare Through Flawl...
-
02 May 2025
-
4 min read

- Blog
- Environmental Social & Governance (ESG)
Leveraging AI to Optimize Energy Consumption of...
-
30 Apr 2025
-
18 min read

- Blog
- Advanced Analytics
- Predictive Modeling
Predicting the Unpredictable: Leveraging AI to ...
-
11 Apr 2025
-
3 min read

- Blog
- Demand Forecasting
- Retail
The AI Storefront: How Retail and CPG Leaders C...
-
28 Mar 2025
-
2 min read

- Blog
- Advanced Analytics
When and Where GenAI Actually Makes Sense in Kn...
-
28 Mar 2025
-
16 min read


- Blog
- Advanced Analytics
- Retail
Navigating Ethical Issues of AI in Retail
-
12 Mar 2025
-
4 min read

- Blog
- Advanced Analytics
- Generative AI & LLM
How Generative AI is Transforming Retail Custom...
-
12 Mar 2025
-
5 min read


- Blog
- Data Governance
Back to Basics: Essentials for Product Developm...
-
20 Feb 2025
-
23 min read


- Blog
- Advanced Analytics
- Generative AI & LLM
How Text Analytics and Generative AI Are Unlock...
-
09 Jan 2025
-
5 min read

- Blog
- BI Reporting & Visualizations
- Business Intelligence & Insights
Transforming BI Reporting and Visualization Wit...
-
06 Jan 2025
-
5 min read

- Blog
- Cloud Infrastructure Modernization
- Platform Management
Mastering Cloud Cost Optimization for a More Ef...
-
03 Jan 2025
-
5 min read

- Blog
- Advanced Analytics
- Generative AI & LLM
How Generative AI is Transforming the Retail Ex...
-
20 Dec 2024
-
21 min read

- Blog
- Advanced Analytics
Preparing your Business for an AI-Driven Future
-
19 Dec 2024
-
10 min read

- Blog
- Advanced Analytics
What it Means to be Human in the Age of AI
-
12 Dec 2024
-
18 min read

- Blog
- Business Intelligence & Insights
- Reporting Modernization
How EZConvertBI Simplifies Your Looker Migration
-
12 Dec 2024
-
4 min read

- Blog
- Advanced Analytics
- Business Intelligence & Insights
Transforming Business Intelligence with Looker
-
12 Dec 2024
-
6 min read

- Blog
- Advanced Analytics
- Data Governance
Key Challenges in AI Adoption for Businesses
-
11 Dec 2024
-
13 min read

- Blog
- Advanced Analytics
- Generative AI & LLM
What AI Disruption Means for Businesses
-
05 Dec 2024
-
15 min read

- Blog
- Advanced Analytics
- Business Intelligence & Insights
Optimizing Your Cloud Data Platform with Google...
-
04 Dec 2024
-
7 min read

- Blog
- Advanced Analytics
- Amazon Quicksight
From Shopfloor to Boardroom: Get Your Data to T...
-
21 Nov 2024
-
5 min read

- Blog
- BI Reporting & Visualizations
- Build & Migrations
Let Your Data Speak to You – Unlocking Organiza...
-
12 Nov 2024
-
5 min read

- Blog
- Advanced Analytics
- Business Analytics
The Joy of Decision-Making and Why It Matters
-
12 Nov 2024
-
5 min read

- Blog
- Data Management
- Strategy & Assessments
Understanding Data Products
-
11 Nov 2024
-
4 min read

- Blog
- Advanced Analytics
- Generative AI & LLM
Crafting User-Focused Solutions and Building an...
-
06 Nov 2024
-
12 min read

- Blog
- Architecture & Engineering
- Cloud Infrastructure Modernization
How Data Mesh is Shaping the Future of Data Man...
-
05 Nov 2024
-
8 min read

- Blog
- Business Intelligence & Insights
- Reporting Modernization
Streamline your Power BI Migration with EZConve...
-
22 Oct 2024
-
4 min read

- Blog
- Advanced Analytics
Maximizing Business Transformation Through AI a...
-
15 Oct 2024
-
18 min read

- Blog
- Advanced Analytics
- BI Reporting & Visualizations
How Gen AI and Microsoft Copilot are Reshaping ...
-
03 Oct 2024
-
5 min read

- Blog
- Advanced Analytics
- Build & Migrations
Transforming Data Capabilities by Moving Beyond...
-
25 Sep 2024
-
5 min read

- Blog
- Business Analytics
- Business Intelligence & Insights
How to Build a Restaurant Performance Measureme...
-
24 Sep 2024
-
6 min read

- Blog
- Advanced Analytics
- Business Analytics
Leveraging Data Science and AI to Drive Innovat...
-
16 Sep 2024
-
16 min read

- Blog
- Advanced Analytics
- Generative AI & LLM
The Role of Mature Data and AI in Accurate Gene...
-
26 Aug 2024
-
14 min read

- Blog
- Advanced Analytics
- Business Analytics
Listening to the Voice of the Customer: A Key t...
-
21 Aug 2024
-
6 min read

- Blog
- Azure
- BI Reporting & Visualizations
Moving from Tableau to Power BI: Why Companies ...
-
20 Aug 2024
-
6 min read

- Blog
- Advanced Analytics
How AI Impacts the Ways We Develop and Grow Dat...
-
14 Aug 2024
-
18 min read

- Blog
- Advanced Analytics
- Demand Forecasting
How to Use Demand Forecasting to Improve Busine...
-
12 Aug 2024
-
6 min read

- Blog
- Business Intelligence & Insights
- Cloud Infrastructure Modernization
Building a Data Platform on Snowflake
-
01 Aug 2024
-
5 min read

- Blog
- Advanced Analytics
- Demand Forecasting
Why Your Demand Forecasting Model Doesn’t Work ...
-
30 Jul 2024
-
7 min read

- Blog
- Advanced Analytics
- Data Governance
Expert Insights on Demonstrating the Value of D...
-
22 Jul 2024
-
9 min read

- Blog
- Advanced Analytics
- Generative AI & LLM
How to Effectively Harness Gen AI for Your Busi...
-
18 Jul 2024
-
5 min read

- Blog
- Advanced Analytics
- Generative AI & LLM
Navigating the AI Hype Cycle by Setting Realist...
-
11 Jul 2024
-
15 min read

- Blog
- Advanced Analytics
- Data Management
Leveraging AI Technology in Healthcare
-
10 Jul 2024
-
17 min read

- Blog
- Advanced Analytics
- Data Governance
Expert Insights on Leveraging Data Quality and ...
-
01 Jul 2024
-
8 min read

- Blog
- Data Governance
- Privacy Governance & Compliance
Choosing the Right Data Governance Approach for...
-
24 Jun 2024
-
5 min read

- Blog
- Data Governance
- Privacy Governance & Compliance
Expert Insights on Leveraging Data Governance f...
-
11 Jun 2024
-
12 min read

- Blog
- Data Governance
- Data Management
The Role of Existing Data Stewards in Driving G...
-
10 Jun 2024
-
3 min read

- Blog
- Data Governance
- Data Management
Optimizing Data Governance Programs Beyond Chec...
-
03 Jun 2024
-
4 min read

- Blog
- Data Governance
- Privacy Governance & Compliance
Measuring Data Governance Progress With Metrics...
-
29 May 2024
-
4 min read

- Blog
- Data Governance
- Data Management
Decoding Data Governance: Going Beyond its Name
-
22 May 2024
-
5 min read

- Blog
- Business Analytics
- Business Intelligence & Insights
How Your Data Governance Strategy Supports Data...
-
15 May 2024
-
4 min read

- Blog
- Data Governance
- Privacy Governance & Compliance
The Need for Data Governance in a Changing World
-
13 May 2024
-
4 min read

- Blog
- Manufacturing
How Smart Manufacturing and Digital Twins Are H...
-
06 May 2024
-
6 min read

- Blog
- Advanced Analytics
- Data Management
Crafting a Data Strategy to Support AI in Healt...
-
30 Apr 2024
-
13 min read

- Blog
- Data Management
- Data Privacy & Regulatory Compliance
How to Achieve Compliance Excellence in Healthc...
-
24 Apr 2024
-
5 min read


- Blog
- Environmental Social & Governance (ESG)
- Manufacturing
Modernizing Supply Chains for Resilience and Su...
-
17 Apr 2024
-
8 min read

- Blog
- Advanced Analytics
- Business Analytics
Getting the Absolute Best Data Science Talent t...
-
16 Apr 2024
-
14 min read

- Blog
- Architecture & Engineering
- Data Management
How to Design a Modern Data Architecture
-
10 Apr 2024
-
5 min read

- Blog
- Advanced Analytics
- Predictive Modeling
How to Re-imagine Customer Experience With Pred...
-
10 Apr 2024
-
4 min read

- Blog
- Advanced Analytics
- Generative AI & LLM
Expert Insights on Transformative AI Strategies...
-
10 Apr 2024
-
13 min read

- Blog
- Data Management
- Strategy & Assessments
Why Your Organization Needs a Data Strategy
-
01 Apr 2024
-
4 min read

- Blog
- Data Management
- Strategy & Assessments
Getting Started With Data Strategy: The AI-Led ...
-
28 Mar 2024
-
3 min read

- Blog
- Cloud Infrastructure Modernization
- Cloud Security & Monitoring
The Role of AI and ML in Cloud Security Monitoring
-
21 Mar 2024
-
4 min read

- Blog
- Data Management
- Strategy & Assessments
Getting Started With Data Strategy: The Acceler...
-
20 Mar 2024
-
4 min read

- Blog
- Advanced Analytics
The Role of the Chief AI Officer (CAIO)
-
15 Mar 2024
-
13 min read

- Blog
- Data Management
- Strategy & Assessments
Getting Started With Data Strategy: The Traditi...
-
13 Mar 2024
-
4 min read

- Blog
- Healthcare
- Strategy & Assessments
How Building a Strong Data Strategy Boosts Heal...
-
12 Mar 2024
-
7 min read

- Blog
- Data Management
- Strategy & Assessments
The Do’s and Don’ts of Data Strategy
-
06 Mar 2024
-
6 min read

- Blog
- Advanced Analytics
- Manufacturing
The Role of Advanced Analytics and AI in Reduci...
-
04 Mar 2024
-
5 min read

- Blog
- Advanced Analytics
- Data Management
Reducing Barriers to Complex Data Science Entry...
-
15 Feb 2024
-
14 min read


- Blog
- Amazon Quicksight
- AWS
Mastering the Art of Visual Storytelling: Wavic...
-
29 Jan 2024
-
1 min read

- Blog
- Amazon Quicksight
- AWS
Getting to Know the Tableau-to-Amazon Quick Sui...
-
29 Jan 2024
-
3 min read

- Blog
- Manufacturing
Manufacturing Metrics That Elevate Performance ...
-
24 Jan 2024
-
8 min read

- Blog
- Restaurant
Mastering the Increasingly Complex QSR Landscape
-
18 Jan 2024
-
3 min read

- Blog
- Advanced Analytics
- Manufacturing
Manufacturing in 2024: Key Data and Analytics T...
-
12 Dec 2023
-
8 min read

- Blog
- Advanced Analytics
- Business Analytics
Data-Driven Dining: Three Essential Data, Analy...
-
20 Nov 2023
-
7 min read

- Blog
- Healthcare
2024 Healthcare Trends: Reimagining the Industr...
-
14 Nov 2023
-
6 min read

- Blog
- Advanced Analytics
- Business Analytics
Demystifying Data and Analytics
-
24 Oct 2023
-
12 min read

- Blog
- Healthcare
Exploring Data and Analytics in Healthcare: A Q...
-
12 Oct 2023
-
7 min read


- Blog
- Advanced Analytics
- Predictive Modeling
Revolutionizing Your Customer Experience Measur...
-
04 Oct 2023
-
10 min read

- Blog
- Business Analytics
- Business Intelligence & Insights
How Integrating Reservation and POS Data Can Pr...
-
27 Sep 2023
-
4 min read

- Blog
- Advanced Analytics
- Business Intelligence & Insights
Next-Generation CDOs: A Conversation About the ...
-
25 Sep 2023
-
12 min read

- Blog
- Data Management
How Effective Data Management Helps to Realize ...
-
22 Sep 2023
-
6 min read

- Blog
- Business Intelligence & Insights
Why Data Analytics Projects Fail and How to Ove...
-
22 Sep 2023
-
5 min read

- Blog
- Advanced Analytics
- Machine Learning & MLOps
How to Build Resilient Business Strategies Usin...
-
22 Aug 2023
-
6 min read

- Blog
- Business Analytics
- Manufacturing
3 Ways Data Analytics Can Transform Your Supply...
-
01 Aug 2023
-
4 min read

- Blog
- Business Analytics
- Manufacturing
How is Data Analytics Transforming Production?
-
26 Jul 2023
-
5 min read

- Blog
- Advanced Analytics
- Predictive Modeling
5 Blockers to Effective Artificial Intelligence...
-
24 Jul 2023
-
6 min read

- Blog
- Data Governance
- Data Management
Instilling Data Quality Into Your Data Manageme...
-
20 Jul 2023
-
7 min read

- Blog
- Advanced Analytics
- Business Analytics
3 Ways Engineers Can Drive Business Value with ...
-
18 Jul 2023
-
4 min read

- Blog
- Advanced Analytics
- Predictive Modeling
Calculating ROI for Advanced Analytics Initiatives
-
15 Jul 2023
-
6 min read

- Blog
- Data Management
- Strategy & Assessments
How Business Leaders Leverage Data as a Critica...
-
15 Jun 2023
-
7 min read

- Blog
- Cloud Infrastructure Modernization
- Platform Management
The Importance of Effective Cloud Platform Mana...
-
07 May 2023
-
4 min read

- Blog
- Data Management
How Businesses Benefit from Modern Data Managem...
-
02 May 2023
-
7 min read

- Blog
- Architecture & Engineering
- Data Management
Data Architecture 101: Trends and Terms to Know
-
25 Apr 2023
-
6 min read

- Blog
- Restaurant
Building a Contact-Free Smart System
-
20 Apr 2023
-
2 min read


- Blog
- Build & Migrations
- Data Management
Which Data Storage Solution is Right for Your O...
-
04 Apr 2023
-
6 min read

- Blog
- Manufacturing
What’s Next in Manufacturing? A Q&A With T...
-
02 Mar 2023
-
4 min read


- Blog
- Data Governance
Governing Your Data: How to Start Designing a G...
-
14 Feb 2023
-
3 min read

- Blog
- Data Governance
Data Governance Roles: Who Should Govern Your D...
-
07 Feb 2023
-
4 min read

- Blog
- Financial Services
Financial Services Executive Outlook: The Benef...
-
02 Feb 2023
-
3 min read

- Blog
- Financial Services
Financial Services Executive Outlook: The Path ...
-
26 Jan 2023
-
4 min read

- Blog
- Data Governance
The Path to Data Governance: What Data Will Be ...
-
24 Jan 2023
-
3 min read

- Blog
- ActiveInsights
- Advanced Analytics
The Future of Voice of Customer: 5 Trends to Watch
-
18 Jan 2023
-
8 min read

- Blog
- Financial Services
Financial Services Executive Outlook: Capitaliz...
-
12 Jan 2023
-
4 min read

- Blog
- Data Governance
What is a Customer? How Simple Questions Get Co...
-
05 Jan 2023
-
6 min read

-
29 Nov 2022
-
7 min read


- Blog
- Data Governance
- Data Privacy & Regulatory Compliance
Why a Good Governance, Privacy, and Compliance ...
-
08 Nov 2022
-
7 min read


- Blog
- Data Governance
Data Governance for Business Leaders: 3 Concept...
-
25 Oct 2022
-
5 min read


- Blog
- Financial Services
Financial Services Executive Outlook: The Impac...
-
29 Sep 2022
-
2 min read


- Blog
- Financial Services
Financial Services Executive Outlook: The Reali...
-
22 Sep 2022
-
3 min read


- Blog
- Augment
- AWS
ETL Modernization: Reduce Migration Timelines a...
-
02 Mar 2022
-
4 min read

- Blog
- Advanced Analytics
- Machine Learning & MLOps
Five Steps To Operationalizing Advanced Analyti...
-
24 Nov 2021
-
5 min read

- Blog
- Augment
- Data Privacy & Regulatory Compliance
A New Way to Quickly and Easily Discover PII Da...
-
19 Oct 2021
-
2 min read

- Blog
- Architecture & Engineering
- Augment
6 Reasons You Need an Augmented Data Quality So...
-
16 Sep 2021
-
5 min read

- Blog
- ActiveInsights
- Business Analytics
Ditch the Survey and Really Get to Know Your Cu...
-
15 Jul 2021
-
8 min read

- Blog
- Architecture & Engineering
- Business Analytics
Five Reasons Why Boutique Consulting Firms Are ...
-
21 Jun 2021
-
6 min read
- Blog
- Advanced Analytics
- Machine Learning & MLOps
Deep Multi-Input Models Transfer Learning For I...
-
14 Jun 2021
-
15 min read

- Blog
- Advanced Analytics
- Machine Learning & MLOps
Deep Learning For Natural Language Processing o...
-
08 Jun 2021
-
9 min read

- Blog
- ActiveInsights
- Customer 360
5 Ways to Successfully Win Travelers’ Loy...
-
25 May 2021
-
6 min read

- Blog
- Business Analytics
- Business Intelligence & Insights
Want to Meet Consumer Expectations? Demand Fore...
-
25 May 2021
-
9 min read

- Blog
- Advanced Analytics
- Customer 360
These 3 Top Retail Analytics Trends are Revolut...
-
25 May 2021
-
7 min read

- Blog
- Demand Forecasting
Demand Forecasting Is Always Wrong: Three Ways ...
-
27 Apr 2021
-
5 min read

- Blog
- Architecture & Engineering
- Business Analytics
8 CDOs Share Key Insights on How to Build a Suc...
-
23 Apr 2021
-
6 min read

- Blog
- Business Analytics
- Business Intelligence & Insights
Here’s Why 2021 is Actually the First “Year of ...
-
07 Apr 2021
-
10 min read

- Blog
- Advanced Analytics
- Business Analytics
Five Critical Elements For Successful Customer ...
-
17 Feb 2021
-
5 min read

- Blog
- Architecture & Engineering
- Business Analytics
Everything You Need to Know About Data & A...
-
15 Jan 2021
-
5 min read

- Blog
- Business Intelligence & Insights
- Data Management
What Happens When Insurers Turn to Data Analytics?
-
04 Jan 2021
-
4 min read

- Blog
- Architecture & Engineering
- Data Management
What Happens When ERP Systems Talk? The Results...
-
04 Jan 2021
-
5 min read

- Blog
- Data Management
- Data Privacy & Regulatory Compliance
Compliance Data Management: the Case For Automa...
-
02 Dec 2020
-
5 min read

- Blog
- Architecture & Engineering
- Data Management
Compliance Data Management: Data Preparation Sa...
-
02 Dec 2020
-
7 min read

- Blog
- Business Analytics
- Customer 360
Your Customers Like You, They Really, Really Li...
-
25 Aug 2020
-
9 min read

- Blog
- Predictive Modeling
- Restaurant
Why Micro-Segmentation Matters in a Post-COVID ...
-
10 Aug 2020
-
6 min read

- Blog
- Architecture & Engineering
- Data Management
Data Architecture From Right to Left: Start Wit...
-
18 May 2020
-
6 min read

- Blog
- Business Analytics
- Business Intelligence & Insights
Using Big Data to Better Predict Your Recovery:...
-
11 May 2020
-
8 min read


- Blog
- Cloud Infrastructure Modernization
- Data Management
How to Get Faster, More Reliable Analytics from...
-
04 Dec 2019
-
7 min read

- Blog
- ActiveInsights
- Architecture & Engineering
Take Ownership of the Relationship with Your Di...
-
04 Dec 2019
-
4 min read

- Blog
- ActiveDeliver
- Business Intelligence & Insights
Food Delivery: Who Owns the Customer?
-
05 Nov 2019
-
5 min read


- Blog
- Business Analytics
- Business Intelligence & Insights
Quick Service Restaurants are Ravenous for Big ...
-
03 Apr 2019
-
4 min read

- Blog
- Architecture & Engineering
- Data Management
CDO Summit Key Takeaways
-
02 Apr 2019
-
7 min read

- Blog
- Advanced Analytics
- BI Reporting & Visualizations
2019 Business Intelligence Trends
-
16 Oct 2018
-
3 min read


