Here’s the real challenge: 86% of enterprises run two or more BI platforms. Not because they planned it that way, but because Finance needed Power BI, Operations trusted Tableau, and Sales already used another platform.
The result?
They built sprawl while trying to democratize data. And now this sprawl is what’s slowing down their decisions.
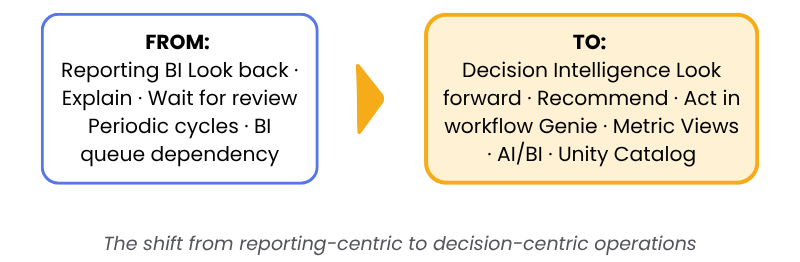
Business users have more dashboards than they ever need. What they don’t have is the trust to act. To move from “something looks off” to “here’s what we’re going to do about it” without filing another BI ticket.
A supply chain planner spots a MAPE spike in demand forecasts. To understand whether it’s a seasonality shift, a data quality issue, or a model degradation problem, they need three different reports, two teams, and a lot of patience. By the time the answer arrives, the window to act has narrowed or closed.
This is not due to a data problem. It’s because of a decision velocity problem.
What needs to change?
The first instinct is to add an AI chatbot on top of existing reports, but that’s the wrong fix.
The reason is, AI-assisted analytics and action fails in most enterprises not due the data model, it is because there’s no shared data definition of various KPIs like, revenue, margin, forecast accuracy, or churn. Even with AI enabled, the different dashboards will continue to calculate the same KPIs differently, and a natural language interface will just return the wrong answers faster. These answers still cannot be trusted.
The fix to this starts at the semantic layer.
Databricks Metric Views let enterprises define KPIs once at the data layer and then make them consistently available across dashboards, AI models, and conversational analytics. KPIs are not per-report calculated fields that drift over time, but rather single, governed, reusable definitions that every downstream consumer inherits.
Pair the KPIs with Unity Catalog for lineage, access control, and metadata governance, and enterprises have a foundation where AI-generated answers are trustworthy because the data they’re grounded in is governed and consistent.
Genie: Conversational analytics that actually works at enterprise scale
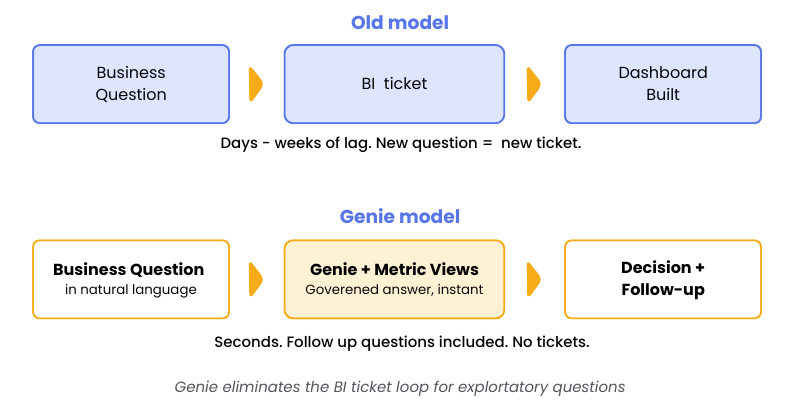
Once the semantic foundation is established, Databricks Genie changes the way business users interact with their data.
Instead of navigating to a dashboard and hoping the right filter exists, a business user asks questions like: “Which customer segments drove the increase in churn last week, and how does that compare to the prior quarter?” Genie generates the answer grounded in Metric Views, by working with a governed semantic context enterprises have defined, and not by hallucinating SQL from scratch.
This matters for two reasons:
- It bypasses the BI ticketing queue for exploratory questions. Analysts stop being report-builders and start being decision architects.
- It’s not open-ended. Genie Spaces are scoped to specific domains demand forecasting, supply chain health, customer analytics, so business users get focused, accurate answers rather than an open SQL interface to the entire Lakehouse.
Not all dashboards should become Genie Spaces. That’s where next-gen rationalization comes in
This is one of the most overlooked problems in BI modernization: enterprises treat migrations as a binary lift-and-shift. Every dashboard is migrated to a new tool or is rewritten from scratch. Both these approaches aren’t always effective..
The real question enterprises should ask for each dashboard is, should it stay as a structured dashboard, should it become a Genie Space where business users ask questions in natural language, or is it even required anymore? The answer depends on how the dashboard is being used.
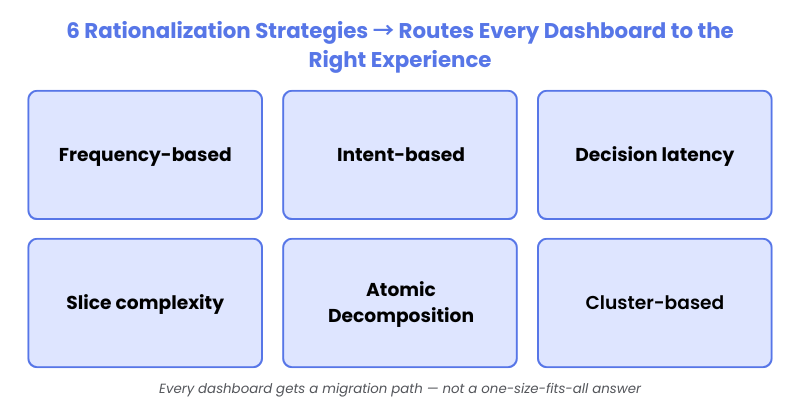
Wavicle’s Next-Gen Rationalization engine inside EZConvertBI for Genie makes this decision systematically using six classification strategies applied against the dashboard usage telemetry:
The output of EZConvertBI is a migration recommendation per asset. It can be, to keep as AI/BI Dashboard, convert to Genie Space, consolidate with a cluster, or retire. No guessing. No manual spreadsheets. A system-driven decision backed by actual usage data from the enterprise’s BI environment.
The KPI inconsistency problem doesn’t solve itself during migration
Most migrations convert dashboards. Almost none deal with the hardest inconsistency problem underneath them: the same KPI defined five different ways across five different reports.
EZConvertBI for Genie surfaces and resolves this through a built-in KPI Dispute Resolution workflow flagging conflicts like:
- Same metric name, different formula
- Same formula, different aggregation grain,
- Same formula, different source table
Business owners can resolve these disputes by choosing the canonical definition, adopting an AI-recommended industry standard, or authoring a custom definition.
The resolved definition is implemented as a Databricks Metric View, and it becomes the single source of truth for every downstream consumer: dashboards, Genie, and AI agents alike.
Without this step, enterprises can migrate the dashboards but inherit the inconsistency. Their AI answers stay untrustworthy, and teams keep arguing about conflicting numbers.
AI/BI dashboards: Structured monitoring + self-service in one layer
Genie handles the exploratory layer. Databricks AI/BI Dashboards handle the structured monitoring layer, and the two work together natively to provide insights.
An example of it is, a logistics manager tracking fulfillment performance can monitor supplier delays and stockout risk on an AI/BI Dashboard, and then pivot into a Genie Space to ask, “which suppliers are most at risk given current lead-time signals?”. They would do that without switching tools, exporting data, or raising a ticket.
Enterprises will use structured views for monitoring and conversational exploration for investigation. One governed data layer underneath both.
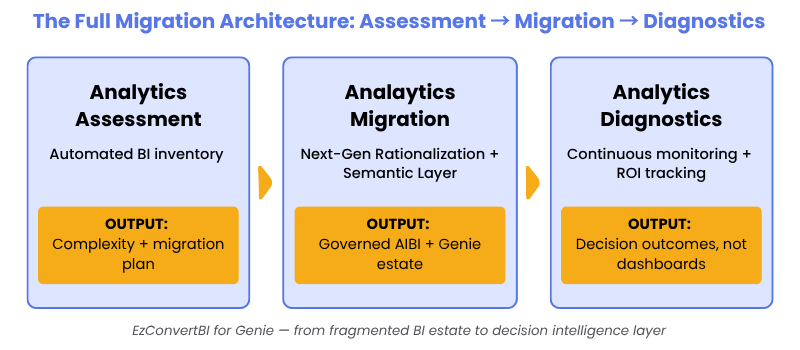
Most enterprises don’t start from a clean slate. They start with 150–400 dashboards across Tableau and Power BI, metric definitions that vary by team, and no automated way to understand which reports are used. EZConvertBI for Genie takes the BI migration from a manual, high-risk project to a structured, AI-assisted process (assessment, migration, diagnostics) with human-in-the-loop controls at every decision point.
The bottom line
The competitive advantage in 2026 isn’t who has the most dashboards, the most AI features, or even the most data. It’s decision velocity, how fast teams can move from signal to action while the context is still relevant.
That starts with getting the semantic foundation right: Metric Views for consistent KPIs, Unity Catalog for governance, Genie for exploration, and AI/BI Dashboards for monitoring. And developing this semantic foundation requires retiring dashboards, not just migrating the ones that are creating noise, and not providing any signal. With EZConvertBI for Genie’s Next-Gen Rationalization, that decision is systematic and data-driven, not a guess.
More BI doesn’t democratize decisions. The right BI governed, semantic, rationalized, and AI-ready does.